Data Center InfrastructureIn AI power, capacity is booked before it is bought.
Data Center Infrastructure/NRG 인사이트
In AI power, capacity is booked before it is bought.
Data centers are on course to nearly double electricity use from 2025 to 2030. The equipment and grid connections behind them run on different clocks. Public reservation terms show what paying for a factory slot can secure, what remains open, and why shorter equipment queues need not deliver usable power sooner.
저희는 사이트 이용 현황을 파악해 서비스를 개선하기 위해 쿠키를 사용합니다. 필수 쿠키는 항상 적용되며, 전체 허용과 전체 거부, 또는 원하시는 항목만 선택하실 수 있습니다. 자세히 보기
공유
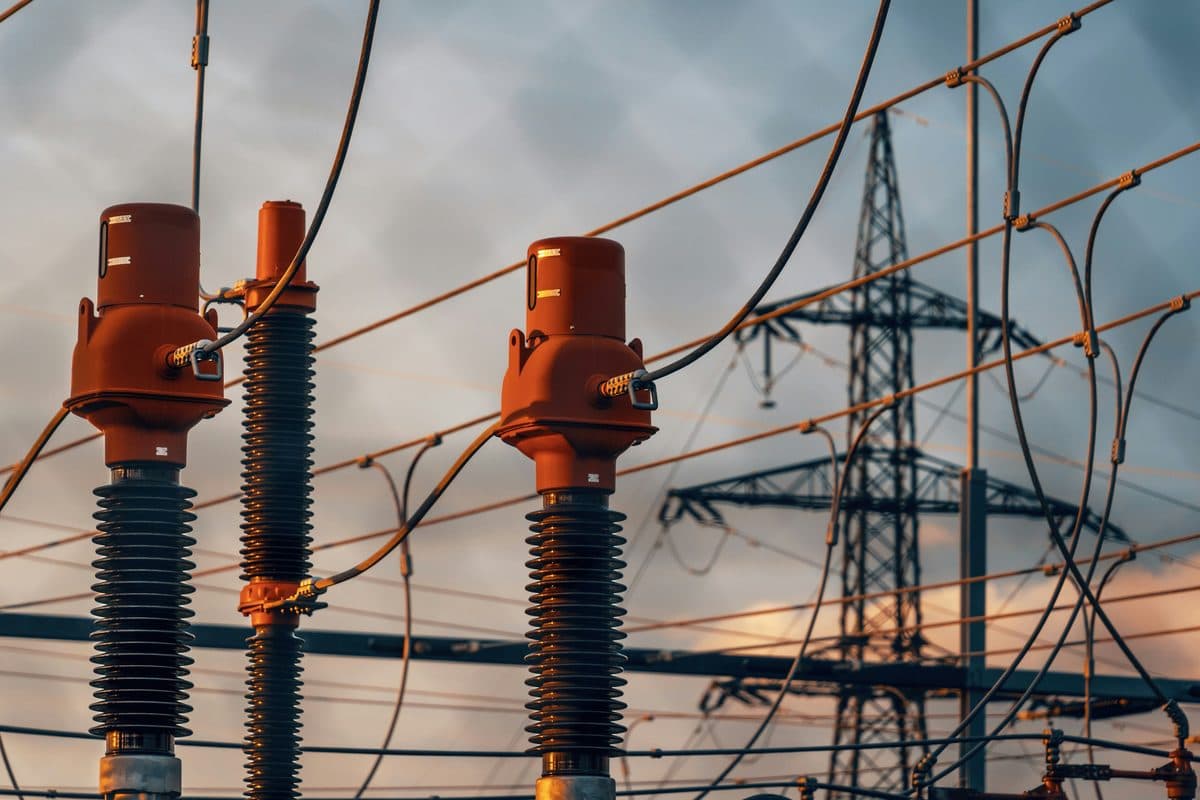
High-voltage equipment ties a campus to the grid. Manufacturing, connection approval and operation each run on a separate clock.
리서치 본문은 영문으로 제공됩니다.
Utility-class transformers can take years to arrive, while individual building electrical and cooling items have shorter but uneven lead times. Some buyers reserve manufacturing slots ahead of a final purchase agreement. Paying earlier can reduce exposure to factory availability; it does not guarantee delivery or an operating date.
The queue is visible in public construction data, component lead-time surveys and disclosed turbine reservations. Each measures a different commitment. This article separates those measures, examines what a reservation buys, and asks which conditions could ease the bottlenecks through 2030. Originally published November 2, 2026; revised and checked November 5, 2026.
Why an AI hall is a different build
The IEA’s April 2026 update estimates global data-center electricity use at 485 TWh in 2025, 17% above 2024, and projects about 950 TWh by 2030. That implies roughly 14% annual growth from 2025 (NRG calculation). The older 2025 edition’s 415 TWh for 2024 remains a historical anchor. These are global electricity estimates and forecasts; they are not installed generation or equipment orders.
Uptime Institute’s 2026 survey puts the average of respondents’ most common rack densities at 7.8 kW after excluding a few very dense sites. TrendForce’s June 2026 roadmap rates one current AI platform at about 225 kW and a future generation at about 660 kW. Comparing a platform rating with a survey statistic illustrates design intensity, not measured electricity use across the fleet. Higher density requires electrical and thermal plant sized to the chosen platform and its interfaces.
7.8 kW mean modal rack density, excluding very dense sites
About 225 kW for one current platform; about 660 kW expected for a future generation
Cooling
Mostly air, backed by a chilled-water plant
Liquid to the chip through CDUs, plus heat rejection
Design basis
General-purpose server requirements
Platform ratings and electrical / thermal compatibility; no allocation of factory output is implied
Rack density and cooling: Uptime Institute’s July 2026 survey and TrendForce’s June 2026 platform roadmap. Survey statistics and platform ratings measure different populations; future-platform figures remain expectations.
The queue, item by item
Wood Mackenzie’s US benchmark put utility-class power transformers at 128 weeks and generator step-up units at 143 weeks in Q2 2025. Those historical means remain useful where no matching current primary table has been established. JLL’s January 2026 outlook puts the US average for data-center equipment at 42 weeks, 83% above 2019; approximate Americas means range around 35–51 weeks for main electrical items and 11–35 weeks for cooling items.
Item
Lead time
Basis
Generator step-up transformer
143 weeks
Wood Mackenzie, US Q2 2025 mean
Power transformer
128 weeks
Wood Mackenzie, US Q2 2025 mean
Main electrical items
About 35–51 weeks
JLL, 2026 Americas item means
Cooling items
About 11–35 weeks
JLL, 2026 Americas item means
Medium-voltage switchgear
38–63 weeks
C&W 2026, quoted via press
Generators / data-center pad-mounts
60–100 / 68–113 weeks
C&W 2026, quoted via press
Selected US building electrical items and chillers
30–60 weeks
Illustrative NRG estimate; not package-wide
NRG estimate: an illustrative 30–60 weeks for selected US building electrical items and chillers, informed by limited research and public cross-checks. It is not a representative distribution and does not cover utility-class units or longer generator and pad-mount quotations. The public differences reflect product, region and method as well as date. A quoted range is not proven to be only the slowest tail. For a project, the required item and its contract matter more than an average across a shopping list.
Selected US building electrical items and chillers
30–60 weeks
Illustrative NRG estimate: 30–60 weeks, not a package-wide promise or measured distribution. JLL’s 2026 Americas item means and longer press-carried quotations provide context, not identical observations.
Booking before buying
A Canadian power producer’s February 2026 release describes a non-refundable deposit to reserve a turbine manufacturing slot with target delivery by 2030. The final purchase agreement and price remain to be negotiated. Crediting the deposit against the final price avoids double counting equipment expense, but cash paid early still has financing and opportunity costs. The disclosed terms belong to this transaction; they are not a universal equipment contract.
JLL reports that large developers preorder selected materials as far as 24 months ahead and hold 6–12 months of critical components in stock. That supports early procurement as a general response to delay. It does not equate technical compatibility with a reservation. Published reference designs describe engineering requirements; a commercial agreement must establish whether factory capacity is actually committed.
Liquid carries chip heat into the cooling loop while air still removes other heat. Published platform requirements help engineers check compatibility; a design document does not itself reserve equipment.
What a public turbine commitment book measures
At one large US turbine maker, September-end 2026 gas commitments comprised 64 GW of firm equipment backlog and 58 GW of slot reservations, or 122 GW in total. The October release records 13 GW converted from reservations into orders during Q3, alongside new commitments and shipments. The split matters: reserved manufacturing capacity, a firm order and installed operating power are different facts.
Measure
September-end 2026
Meaning
Firm equipment backlog
64 GW
Firm orders awaiting delivery
Slot reservations
58 GW
Reserved slots, distinct from firm orders
Total commitments
122 GW
Backlog plus reservations
Year-end target
At least 130 GW
Issuer guidance, not actual output
One turbine maker’s public Q3 2026 disclosure, released October 28. GW of equipment commitments, not installed power. The year-end number is guidance.
“A reservation moves commitment earlier. It does not shorten manufacturing or close every condition between a factory slot and an operating hall.”
— Nathan Research Group, NRG Insights
Outlook through 2030: what would ease the queue?
US private data-center construction ran at a preliminary seasonally adjusted annual rate of $96.5bn in September 2026, 90.3% above September 2025. Its January–September mean was $70.9bn SAAR (NRG calculation), not dollars actually spent year to date. JLL’s capacity base case grows from 103 GW in 2025 to about 200 GW in 2030. Five compounding intervals start in 2025; this is not a fresh five-year forecast beginning at the revision date.
Announced factory investment adds usable supply only after construction and qualification. The effect on delivery quotes depends on new orders, cancellations and the products each line can actually make.
Grid access can remain constrained after equipment arrives. Korea’s capital-region March 2026 review snapshot had 1,010 MW approved out of 33,592 MW requested, or 3% to date; 10 of 522 applications were approved, or 1.9% (NRG calculation). Those are cumulative mixed-stage shares, not final success probabilities. Texas’s September operations report separately records 9,456 MW approved to energize and 4,132 MW of non-simultaneous observed peak. Requests, approvals and operation cannot be treated as the same load.
NRG’s conditional view is that some building-level queues could ease before utility-class transformers if commissioned, qualified output catches demand. Delivery improvement does not force prices down: materials, product mix and contract lags remain. A hall also needs site readiness, fuel or utility supply and integrated operation. On-site generation can address one constraint while adding others. No market-wide grid-easing date follows from JLL’s connection waits above four years or the dated turbine lead-time evidence.
The August 2026 platform explanation adds a hybrid 800-volt DC path that retains existing building AC infrastructure, alongside a native path with more upstream conversion. It expected hybrid power racks in the second half of 2026 and a row power center in 2027; those are availability targets, not commissioning evidence. Traditional transformers with rectifiers and solid-state approaches are alternatives. New DC interfaces can require new equipment, but a wholesale building-order reset is conditional on the chosen design.
Path
What would have to be true
Where the queue binds
The queue persists
AI build demand outruns commissioned and qualified equipment output.
Required items retain long lead times; a target slot still leaves project risks open.
Some equipment eases
Qualified new lines and cancellations relieve selected product queues.
Item delivery improves; prices and grid access need separate evidence.
Architecture changes
Hybrid or native DC designs move from announced availability to commissioning.
Selected converters and distribution interfaces change; retained AC assets need no automatic rebooking.
Illustrative conditions through 2030, not forecasts. Equipment availability, grid access and architecture choices can move independently.
The practical question is which risk a commitment removes. A target slot addresses manufacturing availability; a definitive order establishes further contractual obligations; delivery puts equipment on site. None alone proves the site can use power. Following those distinctions gives a stronger view of the bottleneck than treating every request, design and reservation as a completed sale.
How this article was built. Public figures come from the IEA’s 2026 update, Uptime’s 2026 survey, JLL’s 2026 outlook, dated Wood Mackenzie benchmarks, Census data, issuer disclosures, grid reports and clearly identified press-carried tables. Figures marked NRG estimate reflect limited research with public cross-checks, not representative sampling. An NRG calculation uses public inputs alone. General operating mechanisms are NRG analysis; disclosed company examples establish only their own terms and periods. Companies are described rather than named. This is business and market research, not investment advice.
NRG와 함께 일하는 방식
Nathan Research Group과 프로젝트를 시작하세요.
Filings show how large the order books have grown and the IEA shows how large the demand is, but neither shows the queue from the inside: how long-lead equipment is planned, reserved and delivered. That knowledge sits with the people who design, make, buy and connect AI halls. Reaching them, compliantly, is what we do.
한국 최초의 전문가 네트워크 — 서울, 2013년부터
연결하는 전문가 유형
Data-center operators and developers
Site selection, power procurement and phasing of AI campuses.
Electrical and cooling equipment makers
How electrical and cooling equipment is specified, built and delivered across the industry.
Grid and utility planners
Interconnection queues, substation build times and Korea's review of large new loads.
Power-distribution engineers
Electrical design for high-density data halls.
Supply-chain analysts
Bottlenecks in electrical steel, copper and power semiconductors.
Different order-to-delivery measures, in weeks. Wood Mackenzie: US means, Q2 2025. JLL: approximate Americas component means, 2026. Quoted ranges from the 2026 C&W guide are carried by CRE Daily; the detailed interactive table was not independently re-extracted. These do not form one market distribution.
Energy-market analysts
Data-center load forecasts and the demand assumptions behind national power plans.
프로젝트 진행 방식
1범위 설정
검토하려는 산업 질문을 구체적인 전문가 조건과 질문 목록으로 정리합니다.
앞두고 계신 결정에 맞춰 구성합니다.
2탐색과 검증
인터뷰 전에 전문가를 한 사람씩 확인합니다. 주제 적합성과 최근 담당 업무, 이해상충 여부를 검토해 컴플라이언스 절차를 마칩니다.
3진행과 정리
고객사 일정에 맞춰 인터뷰를 열고, 필요한 경우 질문별로 정리한 서면 요약도 함께 드립니다.
long-lead power and cooling equipment, the AI data-center power and cooling chain, 나아가 data-center infrastructure market 전반을 검토하고 계시다면, 어떤 결정을 앞두고 계신지 알려주세요.
본 리서치는 공개된 자료와 NRG의 자체 조사를 근거로 작성했습니다. NRG estimate로 표시한 수치는 공개 데이터와 대조해 확인한 반올림 범위입니다. Nathan Research Group은 미공개 중요정보를 요구하거나 중개하지 않으며, 모든 프로젝트를 문서화된 컴플라이언스 절차에 따라 진행합니다.